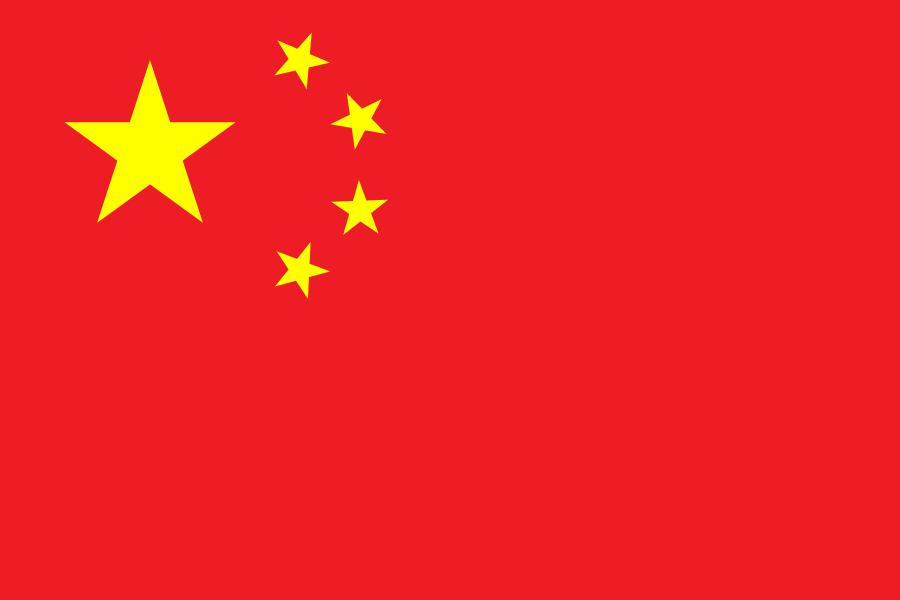
A structured comparison across 23 available indicators. Country A is always cyan; Country B is always amber. Larger inventories are not predictions of combat outcomes.
Country A
Ethiopia
#38 global · #6 in Africa
5.5Military Strength Score / 100
VS
Country B
China
#2 global · #1 in Asia
70.1Military Strength Score / 100
MSS gap64.6 pointsChina has the higher score
Reported values higherA 2 · B 210 tied; “higher” does not always mean “better”
Global positionsA #38 · B #2of 145 country profiles
Change the two countries
Military expenditure trend
Nominal current US dollars from World Bank WDI indicator MS.MIL.XPND.CD. The underlying series is attributed to SIPRI and may differ from the inventory-edition budget above.
A · EthiopiaB · China
A · 2024$921.7M
B · 2024$313.7B
A
EthiopiaCYAN COLUMN
B
ChinaAMBER COLUMN
Country context
PopulationChina +1,271,112,949
A · Ethiopia135,472,051World Bank 2025
B · China1,406,585,000World Bank 2025
Nominal GDPChina +$19.37T
A · Ethiopia$126.4BWorld Bank 2025
B · China$19.50TWorld Bank 2025
Land areaChina +8,259,711.2 km²
A · Ethiopia1,128,498.8 km²World Bank 2023
B · China9,388,210 km²World Bank 2023
Defense budget per residentChina +$187.9
A · Ethiopia$27.5Derived · population 2025
B · China$215.4Derived · population 2025
Active troops per 1,000 residentsEthiopia +2.27
A · Ethiopia3.71Derived · population 2025
B · China1.45Derived · population 2025
Manpower
Active troopsChina +1,532,000
A · Ethiopia503,000
B · China2,035,000
Reserve troopsChina +372,000
A · Ethiopia138,000
B · China510,000
ParamilitaryChina +625,000
A · Ethiopia0
B · China625,000
Air force
Total aircraftChina +3,425
A · Ethiopia104
B · China3,529
Fighter aircraftChina +1,418
A · Ethiopia25
B · China1,443
Attack aircraftChina +371
A · Ethiopia0
B · China371
Transport aircraftChina +662
A · Ethiopia46
B · China708
HelicoptersChina +974
A · Ethiopia33
B · China1,007
Attack helicoptersChina +274
A · Ethiopia7
B · China281
Navy
Total naval assetsChina +403
A · Ethiopia0
B · China403
Aircraft carriersNot comparable
A · EthiopiaN/A
B · China3
DestroyersNot comparable
A · EthiopiaN/A
B · China53
SubmarinesNot comparable
A · EthiopiaN/A
B · China61
FrigatesNot comparable
A · EthiopiaN/A
B · China46
Army and ground forces
TanksChina +5,532
A · Ethiopia338
B · China5,870
Armored vehiclesChina +143,454
A · Ethiopia8,586
B · China152,040
Self-propelled artilleryChina +2,798
A · Ethiopia142
B · China2,940
Towed artilleryChina +931
A · Ethiopia469
B · China1,400
Multiple-launch rocket systemsChina +2,691
A · Ethiopia79
B · China2,770
Financial and strategic
Defense budgetChina +$299.3B
A · Ethiopia$3.7B
B · China$303.0B
Defense budget share of GDPEthiopia +0.1%
A · Ethiopia1.0%
B · China0.9%
Estimated nuclear warheadsChina +620
A · Ethiopia0
B · China620
What this comparison cannot tell you
A larger reported inventory or MSS score is not a prediction of military success. Readiness, training, maintenance, geography, logistics, technology quality, alliances, doctrine and objectives sit outside this table.
Country inventory baseline: 2026 edition. Population, GDP, land-area context and military-expenditure trends: World Bank WDI, with the observation year shown at the decision point. Nuclear totals: FAS beginning-of-2026 estimates. Source links and structure reviewed August 25, 2026.

 MILITARYDEX